Strip bobsledding down to its essence – one human being and the slightest of sleds – and you have skeleton, a sport whose name comes from the bare-bone metal frames first used in 1892.
In many ways, skeleton is one of the simplest sports. After the initial push-off, the only factors determining success are the driver’s skill and the external forces acting on driver and sled: gravity, airflow, and friction. Yet, these forces can take on so many characteristics and have such a profound effect on performance that researchers are using advanced approaches such as 3D reverse engineering, computational fluid dynamics (CFD), and visualization to shave off the precious tenths of seconds that can make the difference between an Olympic medal and disappointment.
From Bikes to Sleds
In the forefront of research on applying advanced technologies to sports that rely on the closest of man-machine interaction is Sports Engineering @ CSES, operating out of Sheffield Hallam University in Sheffield, UK. Led by Dr. John Hart, Sports Engineering @ CSES combined Geomagic 3D scanning software, CFD, and extreme visualization to help the British Cycling Team win four Olympic medals in the 2004 Athens Summer Games.
The work of Sports Engineering @ CSES did not escape the attention of Dr. Kristan Bromley, a former engineer with British Aerospace. After leaving the aerospace industry in the mid-1990s, Bromley began applying aerospace technology such as finite element analysis (FEA) and physical and structural simulation to skeleton bobsledding. Along the way, he became a world-class athlete, competing for Great Britain in the Olympics and winning the world skeleton championship in the 2003/2004 season.
Bromley decided that the Sports Engineering group’s work could be a key factor in preparing for the 2006 Winter Olympics in Turin. There was plenty of motivation for Bromley: despite the fact that he would be going into the 2006 Olympics as the reigning skeleton champion, he had finished 13th in the 2002 Winter Olympics in Salt Lake City. While that might be an expected result for an athlete from a country devoid of mountains and snow, it was not even close to being satisfactory for Bromley.
Bromley’s team, called Pro RACE, develops, manages and delivers R&D as part of a focused sled-development program. As part of that program, Pro RACE turned over the CFD simulation research to Sports Engineering @ CSES.
Capturing Sled and Athlete
Although they might seem vastly different on the surface, there is a lot of commonality between Sports Engineering’s work with cyclists and the skeleton research: both involve men riding on very lightweight vehicles, where the interaction of the human with the surrounding environment is just as important as the structural dynamics of the bike or sled. And, in both cases, aerodynamics is a major performance factor.
Dr. John Hart scans skeleton bobsled using a 3D Scanners ModelMaker X70 with a FARO Golden Arm
Simulating a real-world skeleton environment required much of the same type of work that Sports Engineering @ CSES did for the British Cycling Team. Sports Engineering researchers needed to capture precise geometry for the driver (also called a “slider”) and the sled, create a highly accurate digital model of the two, then simulate and visualize the complex airflow factors that affect performance. Hart’s digital toolbox for making that happen included a ModelMaker X70 laser scanner from 3D Scanners, Geomagic Wrap 3D point cloud reconstruction software, Fluent GAMBIT software for preprocessing, FLUENT software for CFD simulation, and CEI’s EnSight for visualizing the myriad factors that come into play among driver, sled, and environment over time.
Sports Engineering @ CSES initially scanned a skeleton sled with a mannequin to capture data and test out a few theories. But the real work was done based on a scan of Bromley in the racing position on a competition sled.
“It is essential to have the true geometry of the actual athlete for whom the equipment is being designed in an event like the skeleton, where aerodynamics can be so important and so athlete-specific,” says Hart. Those specifics can come down to such physical characteristics as the size of the athlete’s posterior, which can contribute significantly to the overall drag according to Hart.
Hart used the ModelMaker X70 with a FARO Gold Arm to capture the sled alone and Bromley in position on the sled. Besides the standard problems associated with scanning, such as shiny surfaces and areas difficult to access, capturing a live athlete entails other challenges, most notably trying to keep the athlete still during a process that can take around an hour.
“The athletes begin to twitch and ache, so you have to try to make them as comfortable as possible, and then make certain they get back in the correct positions if they need to get up and move about,” says Hart. “It’s not so much of an issue with a skeleton athlete, as their sport-specific posture is lying down.”
Reconstructing the Physical World
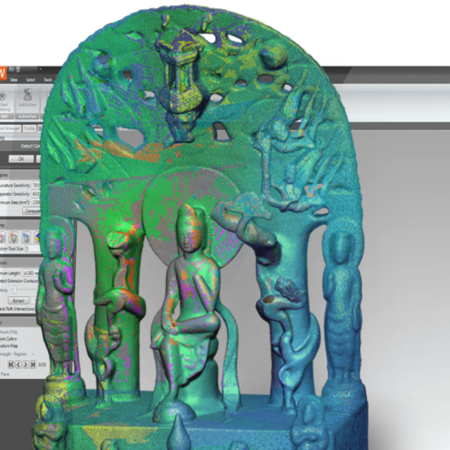
The combined scan data from the sled and Bromley on the sled was about five million points when it was brought into Geomagic Wrap software for refinement and surfacing. Geomagic Wrap is the core technology for creating usable 3D data from scanned point clouds, allowing users to duplicate any object accurately in a computer for downstream design, engineering, and custom manufacturing.
Once the raw point-cloud data was imported into Geomagic Wrap, it was refined to remove any noise picked up from the scanner. The data was automatically reduced to a workable size, while still maintaining dense point cloud data when needed for detail.
“Geomagic allowed us to easily clean up any imperfections in the scanned data, such as areas where Bromley might have moved inadvertently,” says Hart. “The software smoothed the data and enabled us to produce the high-quality NURBS model that we required for the simulation. No other tool could have produced these types of accurate surfaces so quickly and easily from such complex scan data.”
The Geomagic model was output as an IGES file and imported into GAMBIT, Fluent’s geometry and mesh generation software. The completed mesh was imported into FLUENT CFD software, which was used by Sports Engineering to simulate the aerodynamics of the driver and sled and to determine where improvements can be made.
Seeing the Data in New Ways
While FLUENT results gave Sports Engineering good data on aerodynamics, researchers needed a higher level of visualization to illuminate the CFD results. The FLUENT results were brought into EnSight for what is called “extreme visualization,” not because it is used only in extreme cases, but because the software enables interactions to be seen in new and revealing ways.
“There is no substitute for this type of visualization,” says Hart. “It enables us to produce high-quality graphical output easily and quickly for detailed analysis, communication of results, and even marketing presentations.”
Hart’s group exported case file data directly from FLUENT into EnSight and then manipulated the model on the screen to get the best views on what was taking place. To display factors such as surface pressures and surface oil flows, researchers swept clip planes through the model. This enabled them to analyze the entire model quickly. Streamlines within EnSight were used to obtain detailed information on how swirling air flows are formed and where they migrate over time.
When researchers found something interesting, they generated a reference image within EnSight or produced an animation to convey results to the client.
Although Sports Engineering often uses CEI’s free EnLiten geometry viewer to distribute results to colleagues and customers, for this project results were communicated with still images for short technical reports and with animations generated directly from EnSight for face-to-face meetings.